Geiger Müller Design Notes
4. Arduino Source Code
This section contains Arduino source code for testing the Proportional Counter Circuit through an ADC-SPI AD7680 interface. The AD7680 is the interface chip for using within the electronics bay for communication with the Command and Data Handling Subsystem, CDH. The CDH is simulated using an Arduino Uno, whose source code provides the appropriate data processing implementation algorithms. Figure 4.1 shows the test setup area.
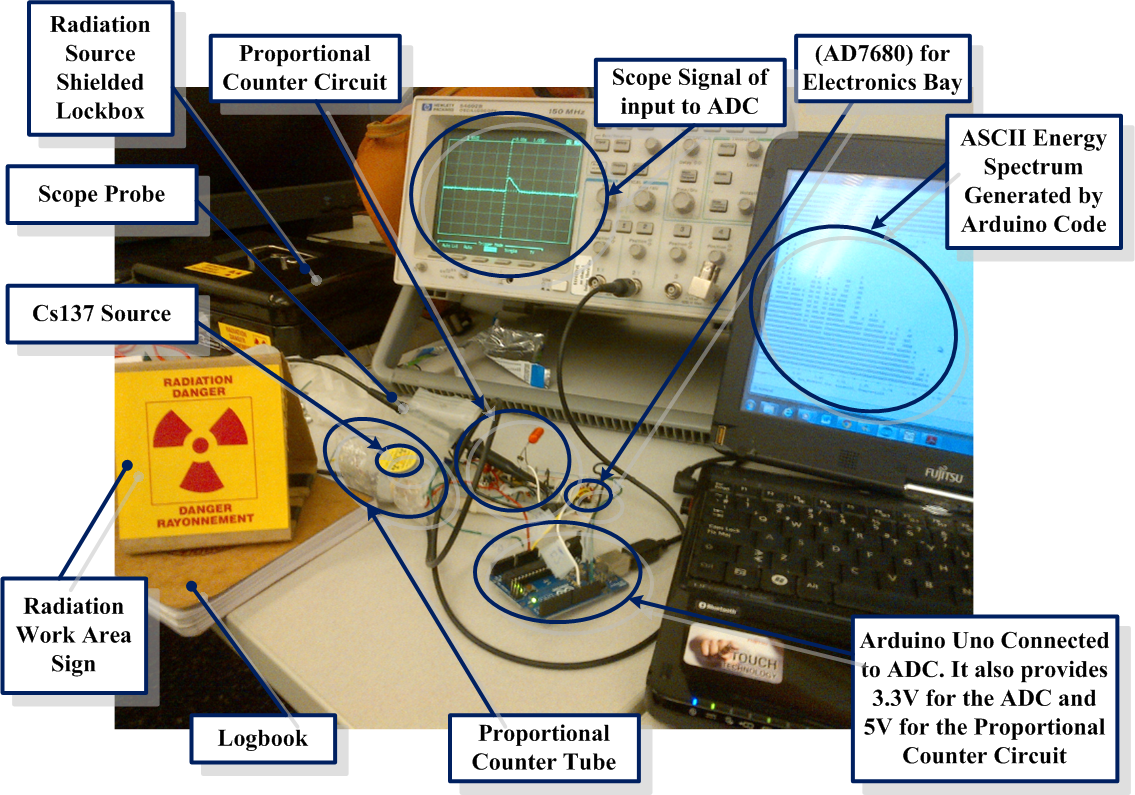
Figure 4.1: Proportional Counter Circuit Testing Workbench.
The following is an enumerated list of the Arduino source code elements along with appropriate user comments.
- Header Section:
- Initialization Section:
- Histogramming Section:
- AD7680 Reader Section:
- Proportional Counter Routines Section:
- Main Loop Section:
The following snippet contains the global definitions for the code. The most important parameters are, the trigger level
// set event trigger voltage level < vdd
#define TRIGGER_VOLTAGE 0.2
and the maximum voltage level,
#define delta_v 1.1 // USER: defined Voltage Range <= vdd
both of which should be ≤ Vdd
// define ADC rail voltage
#define vdd 3.3
The TRIGGER_VOLTAGE determines the threshold at which events are recorded; for the Geiger it is typically within the range 0.2 — 0.25V. The delta_v is used in conjunction with the TRIGGER_VOLTAGE for determining histogram window, i.e., [TRIGGER_VOLTAGE, delta_v]; cf., Figure 4.2.
//////////////////////////////////////////////
// PAYLOAD RADIATION COUNTER DEVELOPMENT CODE
//
// This code is for interfacing the Arduino
// Uno to the AD7860 ADC chip, for the
// purposes of testing the payload proportional
// counter subsystem.
//
// NOTE: The AD7860 runs off of the 3.3V
//       Arduino line, while the proportional
//       counter runs of 5V.
// __
// Version 1.0
// Date: Sept 22nd, 2012
// Author: Michelle Boyce
//

//
// A D C   D E F I N I T I O N S
//

// define ADC rail voltage
#define vdd 3.3

// set event trigger voltage level < vdd
#define TRIGGER_VOLTAGE 0.2

// define Pin Mapping between the Arduino and ADC
#define AD_CS   10 // Arduino Pin D10 -> ADC Pin 8 (CS    = MOSI)
#define AD_MISO 12 // Arduino Pin D12 -> ADC Pin 7 (SDATA = MISO)
#define AD_SCLK 13 // Arduino Pin D13 -> ADC Pin 5 (SCLK)


// A C I I   H I S T O G R A M I N G   D E F I N I T I O N S
//
// NOTES:
//   [1] These definitions are used for generating
//       an ASCII histogram of the energy spectrum
//       measured by the detector.
//
//   [2] The number of bins are represent by the
//       number of horizontal characters and the
//       maximum height is represented by the
//       number of lines.
//
#define delta_v 1.1 // USER: defined Voltage Range <= vdd
#define bins    100 // USER: defined number of bins
#define ymax     25 // USER: defined maximum height
float dbin=abs(((float)(delta_v-TRIGGER_VOLTAGE))/((float)bins-1.0)); // Bin width
int hist[bins]; // Histogram Binner
int norm[bins]; // Normalized Binner
The following snippet is used for initializing the Arduino interfaces to the SPI device. The wiring is defined in the definition header, above: i.e.,
// define Pin Mapping between the Arduino and ADC
#define AD_CS   10 // Arduino Pin D10 -> ADC Pin 8 (CS    = MOSI)
#define AD_MISO 12 // Arduino Pin D12 -> ADC Pin 7 (SDATA = MISO)
#define AD_SCLK 13 // Arduino Pin D13 -> ADC Pin 5 (SCLK)
It also initializes the histogram bins.
//////////////////////////////////////////////
//  I N I T I A L I Z A T I O N
//

void setup() {

  // setup pin modes
  pinMode(AD_CS,OUTPUT);
  pinMode(AD_MISO,INPUT);
  pinMode(AD_SCLK,OUTPUT);

  // disable device at startup
  digitalWrite(AD_CS,HIGH);
  digitalWrite(AD_SCLK,HIGH);

  //Set Serial Port Speed
  //Serial.begin(9600);
  Serial.begin(115200);

  // initialize histogramming bins
  for (int i=0;i<bins;++i) {
    hist[i]=0;
    norm[i]=0;
  }

  delay(100);
}
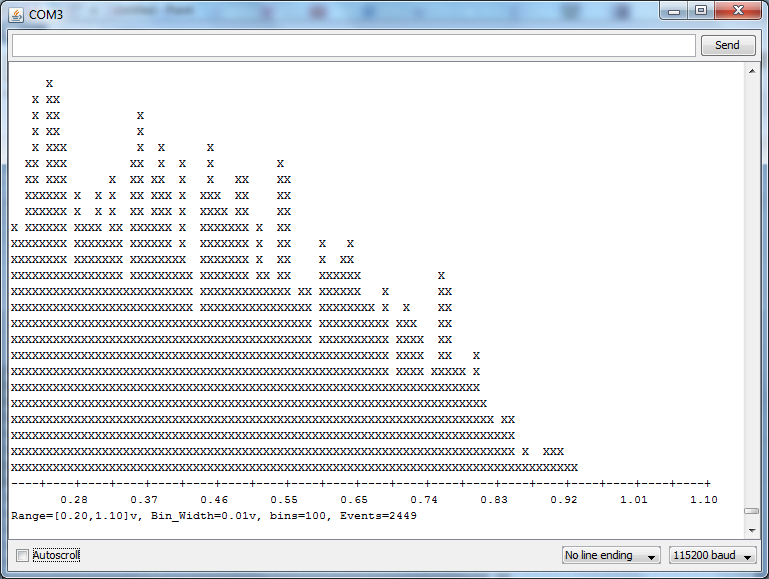 | 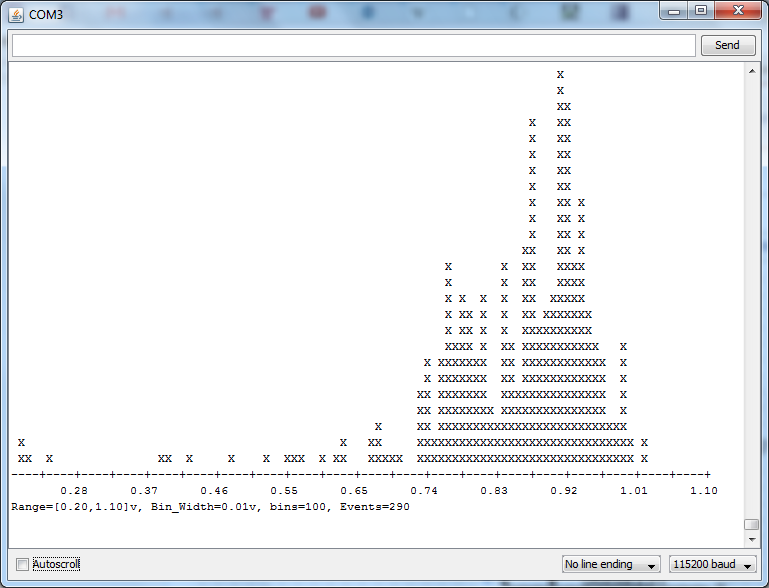 |
| Figure 4.2: Sample Cs137 spectrum (left) and cosmic ray background spectrum (right). | |
The following snippet contains routines for generating energy spectrum histograms of radiation recorded by the tube, cf., Figure 4.2.1
The two main routines are
// histogram binning routine for
// stuffing events into hist[]
void add_to_bin(float voltage) {
   …
}
which adds an event, voltage, to the histogram bin-array, hist[i], indexed to the [TRIGGER_VOLTAGE, delta_v] window, which is divided into bins bins of width dbin (in units of volts), and
// routine for printing normalized hist
void print_hist(float voltage) {
   …
}
which adds an event, voltage, to hist[i], and then dumps an ASCII Histogram to the screen (AKA, serial port),2 cf., Figure 4.2. The aforementioned parameters are defined in the definition code section above, i.e.,
// A C I I   H I S T O G R A M I N G   D E F I N I T I O N S
//
// NOTES:
//   [1] These definitions are used for generating
//       an ASCII histogram of the energy spectrum
//       measured by the detector.
//
//   [2] The number of bins are represent by the
//       number of horizontal characters and the
//       maximum height is represented by the
//       number of lines.
//
#define delta_v 1.1 // USER: defined Voltage Range <= vdd
#define bins    100 // USER: defined number of bins
#define ymax     25 // USER: defined maximum height
float dbin=abs(((float)(delta_v-TRIGGER_VOLTAGE))/((float)bins-1.0)); // Bin width
int hist[bins]; // Histogram Binner
int norm[bins]; // Normalized Binner
For the purposes of display, the histograms are normalized to the maximum value in hist[bins] and scaled to ymax, which represent the number of ASCII lines on the screen, while bins represents the ASCII character width on the screen. This information is stored temporarily in the norm[bins] workspace.
//////////////////////////////////////////////
// H I S T O G R A M I N G
//

// histogram binning routine for
// stuffing events into hist[]
void add_to_bin(float voltage) {

  // define [min,max] bin boundary variables
  float bmin,bmax;
  for (int i=0;i<bins;++i) {

    // set i-th bin boundary
    bmin=i*dbin+TRIGGER_VOLTAGE; // lower bin limit
    bmax=bmin+dbin; // upper bin lower

    // check if voltage in i-th bin boundary
    if (bmin <= voltage && voltage <= bmax) {
      ++hist[i]; // increment i-th bin
      break;
    }
  }

}

int get_number_of_hist_events() {
  int num=0;
  for (int i=0;i<bins;++i) {
    num+=hist[i];
  }
  return num;
}

// routine for creating normalized
// histogram, norm[]
void normlize_hist() {

  int hmax=0;
  for (int i=0;i<bins;++i) {
    if (hmax < hist[i]) {
      hmax=hist[i];
    }
  }

  for (int i=0;i<bins;++i) {
    norm[i]=(int)(((float)(ymax*hist[i]))/((float)hmax));
    if (norm[i] > ymax) {
      norm[i]=ymax;
    }
  }

}

// routine for printing normalized hist
void print_hist(float voltage) {
  add_to_bin(voltage);
  normlize_hist();
  for (int i=ymax;i>0;--i) {
    for (int j=0;j<bins;++j) {
      if (norm[j]>=i) {
        Serial.print("X");
      } else {
        Serial.print(" ");
      }
    }
    Serial.println("");
  }
  for (int i=0;i<bins;++i) {
    if ((i+1)%5) {
      Serial.print("-");
    } else {
      Serial.print("+");
    }
  }
  Serial.println("");
  int hold=1;
  int offset=2;
  for (int i=0;i<bins;++i) {
    if (hold > offset) {
      if ((i+1)%10) {
        Serial.print(" ");
      } else {
        Serial.print(i*dbin+TRIGGER_VOLTAGE);
        hold=0;
      }
    } else {
        ++hold;
    }
  }
  Serial.println("");
  Serial.print("Range=[");
  Serial.print(TRIGGER_VOLTAGE);
  Serial.print(",");
  Serial.print(delta_v);
  Serial.print("]v, Bin_Width=");
  Serial.print(dbin);
  Serial.print("v, bins=");
  Serial.print(bins);
  Serial.print(", Events=");
  Serial.print(get_number_of_hist_events());
  Serial.println("");

}
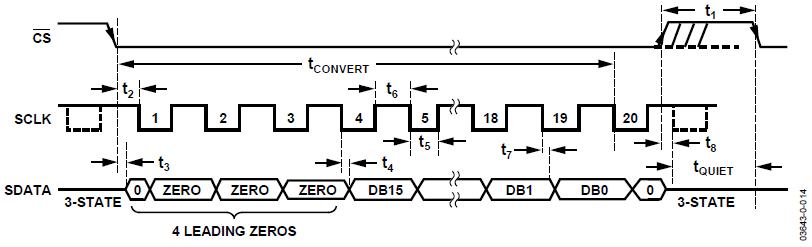
Figure 4.3: AD7680 Timing Diagram [1] Implemented in read_adc().
The following snippet contains the routine read_adc(), which returns the voltage reading from the AD7680 ADC. This routine implements the timing diagram shown in Figure 4.3.
//////////////////////////////////////////////
// S P I   A D 7 6 8 0   R E A D E R
//

// routine reads in ac7680 serial data and
// converts it voltage
float read_adc() {

  //
  // Following 16 bit data sequence as per
  // ad7680 adc data sheet
  //

  // 1) enable chip (will spit out 1st zero)
  digitalWrite(AD_CS,LOW);

  // 2) cycle through next 3 zeros
  for (int i=0; i<3;++i) {
    digitalWrite(AD_SCLK,LOW);
    digitalWrite(AD_SCLK,HIGH);
  }

  // 3) read in adc value
  unsigned int reading=0;
  for (int i=15; i >=0;--i) {
    digitalWrite(AD_SCLK,LOW);
    digitalWrite(AD_SCLK,HIGH);
    reading+=digitalRead(AD_MISO)<<i;
  }

  // 4) increment clock cycle
  digitalWrite(AD_SCLK,LOW);
  digitalWrite(AD_SCLK,HIGH);

  // 5) disable chip
  digitalWrite(AD_CS,HIGH);

  //
  // Done!
  //

  // convert to voltage reading and return
  return vdd*((float)reading)/65536;
}
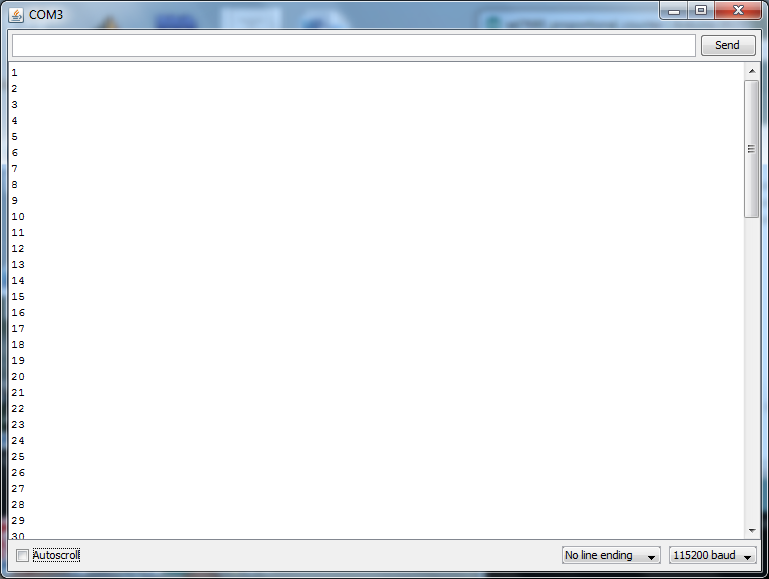 | 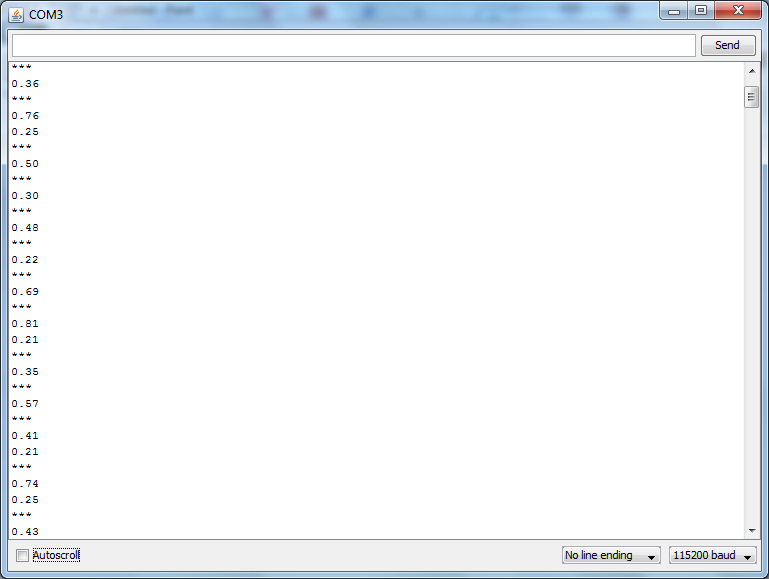 |
| Figure 4.4: Examples of Arduino Serial Event Counts (left) and Dumps (right). | |
The following snippet contains routines for processing proportional counter data: i.e., the on_event_return() routine returns on a detected event, which is use for counting events, Figure 4.4 (left), the on_event_dump_data() routine prints the voltages recorded in an event to the screen, Figure 4.4 (right), which is the raw data used for processing radiation events,4 the on_event_get_peak() routine returns the peak voltage of an event, which is used for radiation spectrum analysis, and the on_nevents_dump_histogram(int nevents) routine prints a histogram to the screen after nevents events have been accumulated, which is used for generating energy spectrums.
//////////////////////////////////////////////
// PROPORTIONAL COUNTER ROUTINES
//

// waits and returns true when an event is detected
int on_event_return() {
  while (read_adc() <= TRIGGER_VOLTAGE) {}
  return 1;
}

// waits and dumps all measured values of an event
// and then returns
void on_event_dump_data() {

  float voltage=0.0;

  while (1) {
    voltage=read_adc();
    if (voltage > TRIGGER_VOLTAGE) {
      while (voltage > TRIGGER_VOLTAGE) {
          Serial.println(voltage);
          voltage=read_adc();
        }
        return;
    }
  }

}

// waits and returns the maximum of an event
float on_event_get_peak() {

  float voltage=0.0;

  while (1) {
    voltage=read_adc();
    if (voltage > TRIGGER_VOLTAGE) {
      float v_max=voltage;
      while (voltage > TRIGGER_VOLTAGE) {
          if (voltage > v_max) {
            v_max=voltage;
          }
            voltage=read_adc();
        }
        return v_max;
    }
  }

  return 0.0;

}

// waits and dumps maximum of an event
// and then returns
void on_event_dump_peak() {
  Serial.println(on_event_get_peak());
}

// bins 100 events, prints histogram, and returns
// NOTE: This routine accumulates events on
//       each call
int on_nevents_dump_histogram(int nevents) {

      for (int i=0;i<(nevents-1);++i) {
        add_to_bin(on_event_get_peak());
      }
      print_hist(on_event_get_peak());

      return 1;
}
The following snippet is the main Arduino loop that is used for dumping event counts (COUNT_EVENTS), event data (DUMP_EVENTS), or event histograms (GENERATE_ENERGY_SPECTRUM), i.e.,
#define COUNT_EVENTS             1 // uses on_event_return()
#define DUMP_EVENTS              2 // uses on_event_dump_data()
#define GENERATE_ENERGY_SPECTRUM 3 // uses on_nevents_dump_histogram()
as determined by a user preselected {\small\tt DIRECTIVE}, i.e.,
int DIRECTIVE=GENERATE_ENERGY_SPECTRUM;
The corresponding routines can be found in the previous code sections mentioned above.
//////////////////////////////////////////////
//  M A I N   L O O P
//

#define COUNT_EVENTS             1 // uses on_event_return()
#define DUMP_EVENTS              2 // uses on_event_dump_data()
#define GENERATE_ENERGY_SPECTRUM 3 // uses on_nevents_dump_histogram()

int DIRECTIVE=GENERATE_ENERGY_SPECTRUM;

void loop() {

  if (DIRECTIVE == COUNT_EVENTS) {
    int count=0;
    while (on_event_return()) {
      Serial.println(++count);
    }
  } else if (DIRECTIVE == DUMP_EVENTS) {

    while (1) {
      Serial.println("***");
      on_event_dump_data();
    }

  } else if (DIRECTIVE == GENERATE_ENERGY_SPECTRUM) {

    int   nevents=10;

    while (on_nevents_dump_histogram(nevents)){
      delay(500);
      Serial.println(" ");
    }

  } else { // DEFAULT: DUMP_EVENTS

    while (1) {
      Serial.println("***");
      on_event_dump_data();
    }

  }

}
All of the aforementioned code sections are placed (in sequence) in a single Arduino source file, ad7680_proportional_counter.pde, for uploading to the board.3
References:
[1] Analog Devices, AD7680 Datasheet, 3 mW, 100 kSPS, 16-Bit ADC in 6-Lead SLOT-23, One Technology Way, P.O. Box 9106, Norwood, MA 02062-9106, U.S.A.
Footnotes:
1The resolution of the Cs137 spectrum can be obtained by adjusting the bins, i.e., "#define bins 100 // USER: defined number of bins," in the initialization section of the Arduino code.
2For Q6 implementation, this could be dumped to a file; mind you, the raw data in hist[i] would be more appropriate.
3 For details on the Arduino please go to http://arduino.cc/en/.
4 This is the data that should, ``ideally,'' be recorded by the Q6, along with temperature, magnetometer, and satellite position (AKA, time-stamp) readings for post processing. In general, the other routines mentioned herein can be used for post processing. That said, there should a mechanism which allows code to be uploaded to the satellite for post-processing, as well as to download data. In general, on_event_dump_data() should be a library function that returns a struct of an event. Library routines which return struct's for temperature, magnetometer, satellite position, and time should also be provided. Uploaded software can then take advantage of these library function calls.
Last Updated: 8:14 PM EST Oct. 30th, 2014